FAQ
FAQMonitoring (Web Console)
AhsayCBS is a web-based centralized management console for backup service administrators or users to manage and monitor backup, restore, replication and redirection activities.
Aside from these, administrators can set up an account with Read-only Admin role to help in the daily monitoring of backup and restore jobs using Live Activities, and other activities using the different report logs.
Monitoring is divided into six sub menus, which are:
Dashboard
To get information regarding the state of your AhsayCBS system, simply click the Dashboard icon under “Monitoring” from your AhsayCBS web console.
![]()
The dashboard is a one-stop overview providing important information that the system administrator should pay attention to, for example, system errors/warnings, the system health conditions and real-time activities of the system. With this information, system administrator can quickly identify potential issues that might pose a threat to the AhsayCBS system and therefore can react accordingly to fix the issues. Below is a summary of the information that the dashboard section provides.
There are seven tabs, each of which is described below:
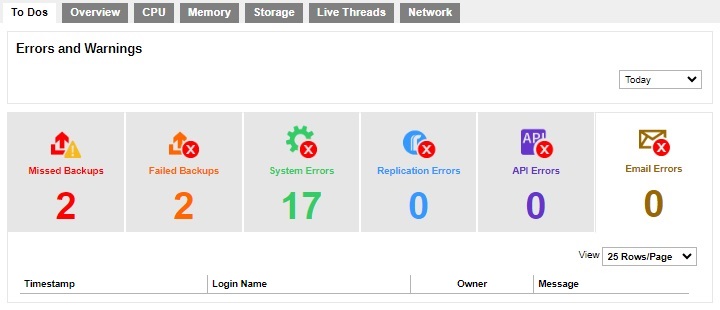
To Dos
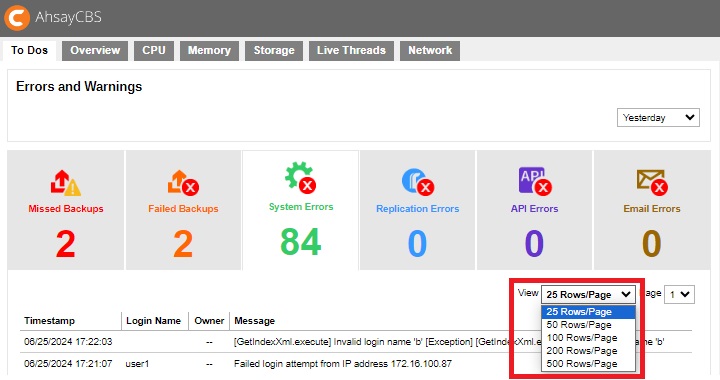
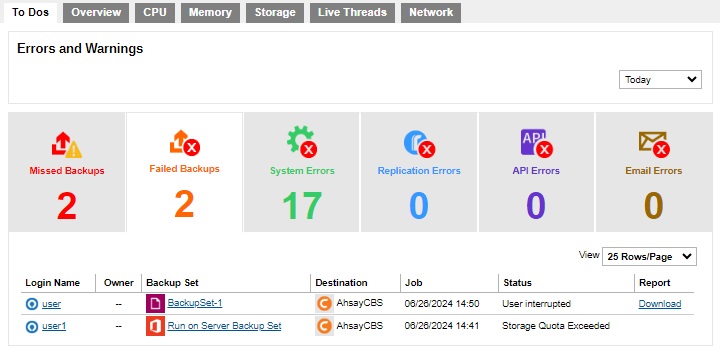
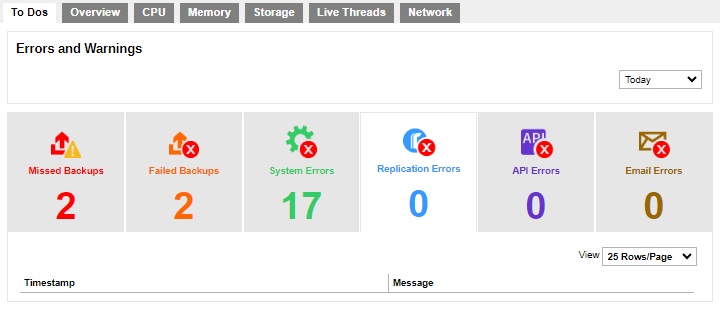
The following shows the “To Dos” tab under Monitoring > Dashboard. It contains system announcement, errors and warnings such as “Missed Backups”, “Failed Backups”, “System Errors”, “Replication Errors”, “API Errors” and “Email Errors”. Administrators and operators can refer to these messages to take corresponding action.
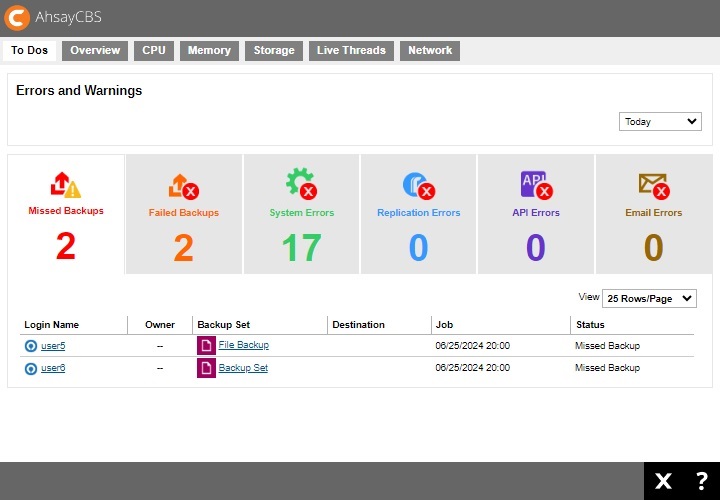
There are two viewing options for the log entries: Logs Period and Number of Rows per Page.
Logs Period
You can select to display the log entries of the errors and warnings from a period of time you selected. Click the drop-down menu on the right in the “Errors and Warnings” section to select the desired period of time.
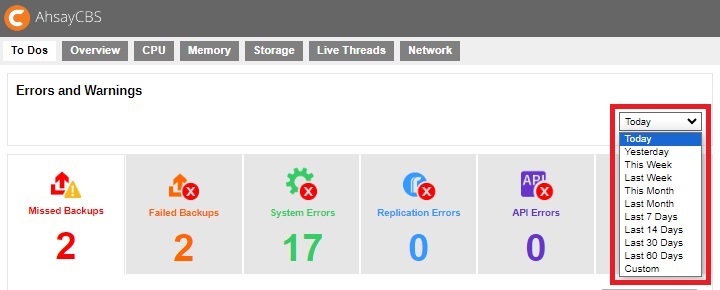
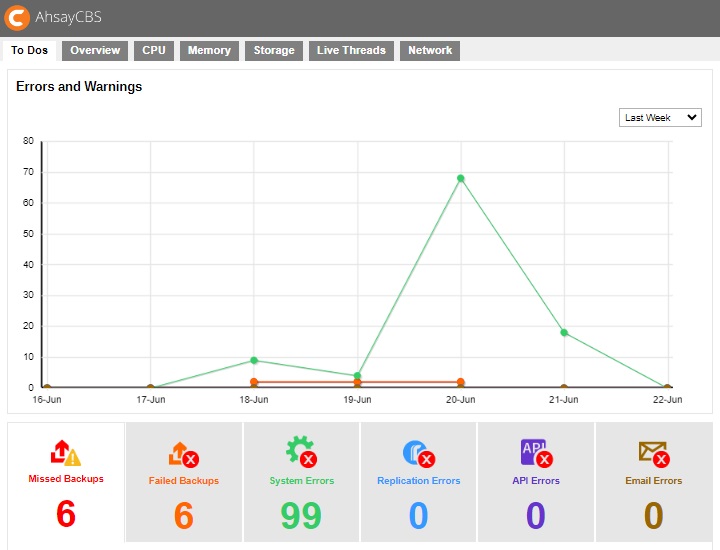
A chart illustrating the number of errors for different types of errors/warning will be displayed if the selected period of time is other than Today and Yesterday.
In the chart below, for example, the vertical axis denotes the number of errors/warnings while the horizontal axis denotes the date. The lines on the chart in different colors correspond to the different types of errors/warnings as shown in the number counter below the chart in their respective colors.
Number of Rows per Page
You can also select the number of rows (i.e. the number of entries) to display on each page. Click on the drop-down menu as shown in the screen shot below to select the desired setting.
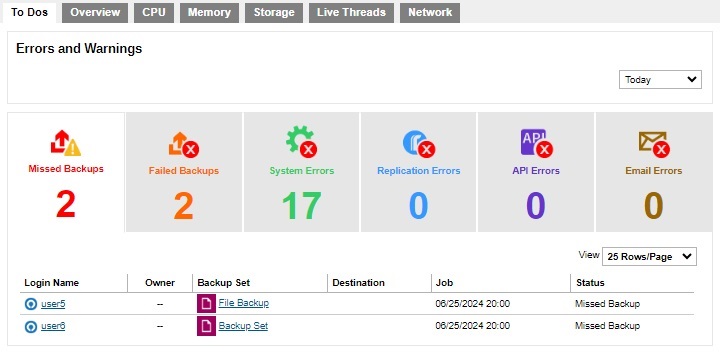
Missed Backups
This page shows all details on all missed backups from all backup users using the AhsayCBS server. Missed backup refers to backup jobs that failed to run according to the set backup schedules. Any backup jobs failed to run backup 6 hours after the scheduled backup time is considered as missed backup.
| Title | Description |
|---|---|
| Login Name | Login name of the backup user. |
| Owner | Owner of the backup account. |
| Backup Set | Name of the backup set that has missed the scheduled backup. |
| Destination | Backup destination of the missed backup. |
| Job | Date and time when the backup job was classified as missed backup. |
| Status | Status of the missed backup job. |
Failed Backups
This page shows all details on all failed backups from all backup users using the AhsayCBS server. Failed backup refers to backup jobs that are not performed successfully. The backup failure could be caused by various reasons, such as storage capacity on the backup destination, Internet connection between the client backup agent and the AhsayCBS server/backup destination, user interruption during backup, etc.
| Title | Description |
|---|---|
| Login Name | Login name of the backup user. |
| Owner | Owner of the backup account. |
| Backup Set | Name of the backup set that has missed the scheduled backup. |
| Destination | Backup destination of the missed backup. |
| Job | Date and time when the backup job was classified as missed backup. |
| Status | Status of the missed backup job. |
| Report | Downloadable report in pdf format. |
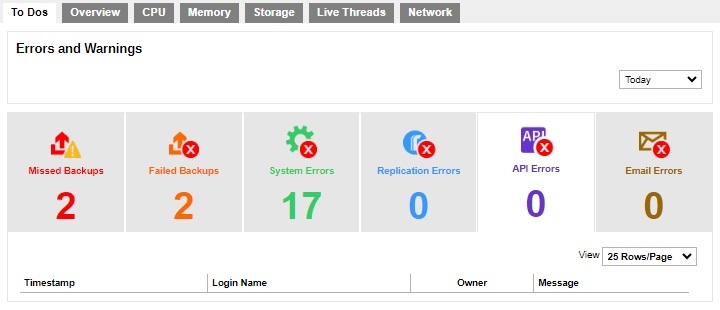
System Errors
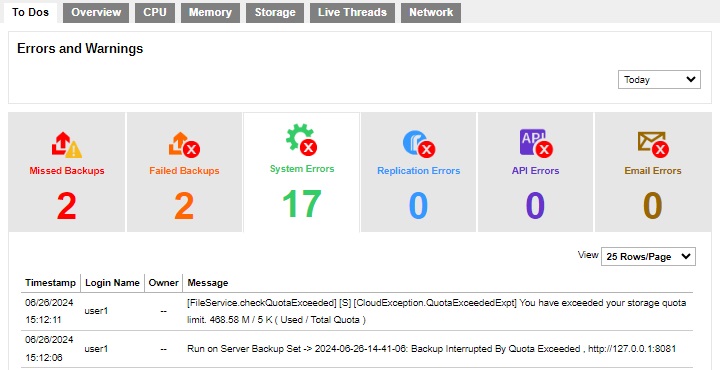
| Title | Description |
|---|---|
| Timestamp | Date and time when system error was recorded. |
| Login Name | Name of the backup user related to the system error. |
| Owner | Owner of the backup account. |
| Message | Message showing the system errors in detail. |
Replication Errors
| Title | Description |
|---|---|
| Timestamp | Date and time when replication error was recorded. |
| Message | Message showing the replication errors in detail. |
API Errors
| Title | Description |
|---|---|
| Timestamp | Date and time when API error was recorded. |
| Login Name | Name of the backup user related to the API error. |
| Owner | Owner of the backup account. |
| Message | Message showing the API errors in detail. |
Email Errors
| Title | Description |
|---|---|
| Timestamp | Date and time when email error was recorded. |
| Login Name | Name of the backup user related to the system error. |
| Owner | Owner of the backup account. |
| Message | Message showing the email errors in detail. |
Overview
The following shows the “Overview” tab under Monitoring > Dashboard.
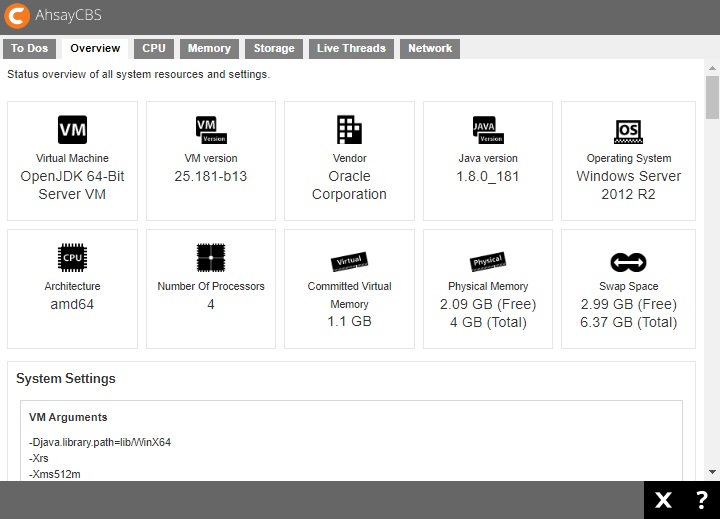
This is an overview of the system resource and system settings. These are useful information for administrator or support staff to collect regarding machine information. This information includes “Virtual Machine”, “VM version”, “Vendor”, “Java version”, “Operating System”, “CPU Architecture”, “Number Of Processors”, “Committed Virtual Memory”, “Physical Memory”, and “Swap Space”.
In addition, a list of system settings such as “VM Arguments”, “Class Path”, “Library Path”, “Boot Class Path” and “System Properties” are shown for reference.
CPU
The following shows the “CPU” tab under Monitoring > Dashboard. Here you can see the current CPU utilization, the percentage that the system and application use.
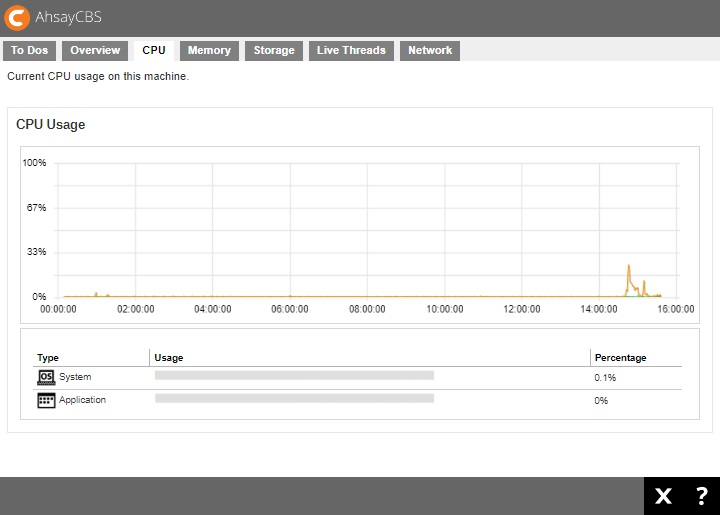
There are two parts of information from this page.
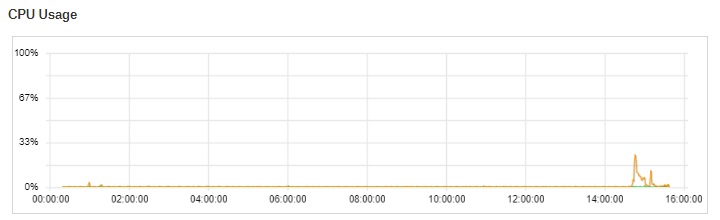
CPU Usage Chart
The CPU Usage shows the daily usage of the machine’s CPU where the AhsayCBS is installed, with the vertical axis denotes the CPU utilization rate while the Y axis denotes the time.
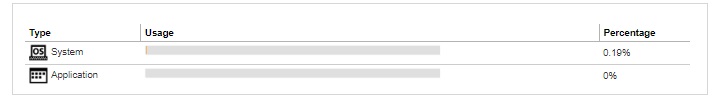
Usage Distribution
This chart shows the CPU usage distribution in percentage on System and Application.
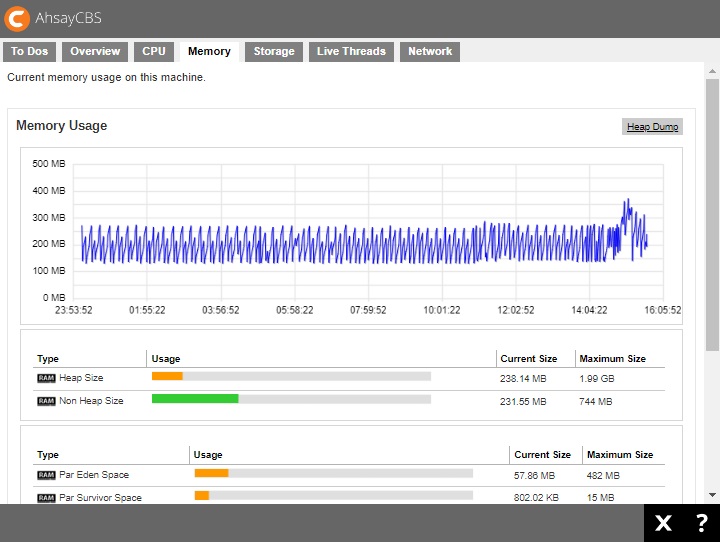
Memory
The following shows the “Memory” tab under Monitoring > Dashboard. This is a graphical view of the memory pool/managers usage on this machine.
| Title | Description |
|---|---|
| Heap Size | The heap memory is the runtime data area from which the Java VM allocates memory for all class instances and arrays. |
| Non Heap Size | Non heap memory includes a method area shared among all threads and memory required for the internal processing or optimization for the Java VM. |
| Par Eden Space | The pool from which memory is initially allocated for most objects. |
| Par Survivor Space | The pool containing objects that have survived the garbage collection of the Eden space. |
| CMS Old Gen | The pool containing objects that have existed for some time in the survivor space. |
| Code Cache | The HotSpot Java VM also includes a code cache, containing memory that is used for compilation and storage of native code. |
| Metaspace | The pool containing all the reflective data of the virtual machine itself, such as class and method objects. With Java VMs that use class data sharing, this generation is divided into read-only and read-write areas. |
| Compressed Class Space | This is part of the metaspace. |
Storage
The following shows the “Storage” tab under Monitoring > Dashboard. This is the local storage and predefined destination usage overview.
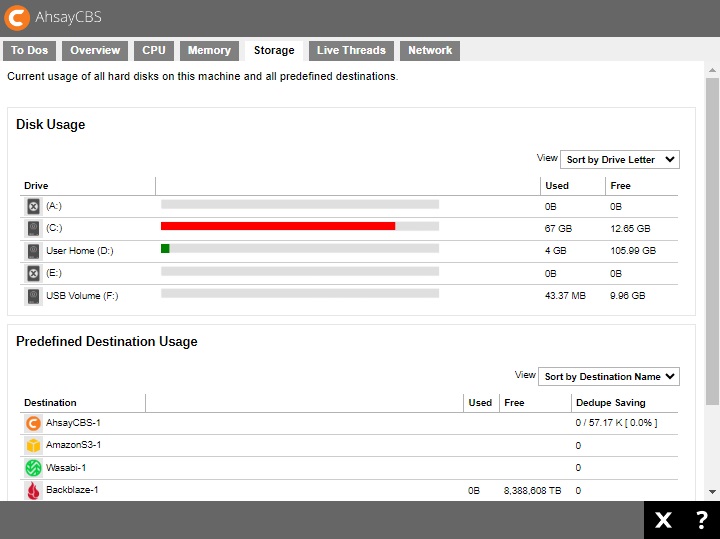
Disk Usage
Under the Disk Usage section, it shows all the drives on the machine where the AhsayCBS is installed. You can see the capacity used (“Used”) and capacity remaining (“Free”) for each drive.
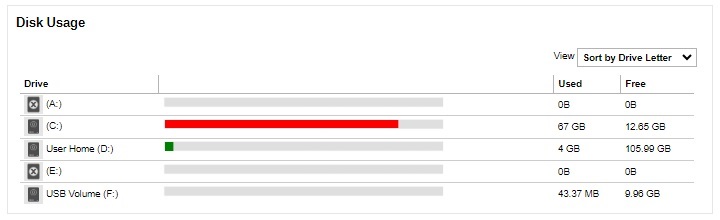
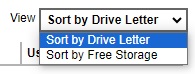
You can select to view the entries in the “Disk Usage” section sorted by Drive Letter or Free Storage.
Predefined Destination Usage
Under the Predefined Destination Usage section, it shows all the predefined destinations that you have added under the System Settings > Basics > Predefined Destination.
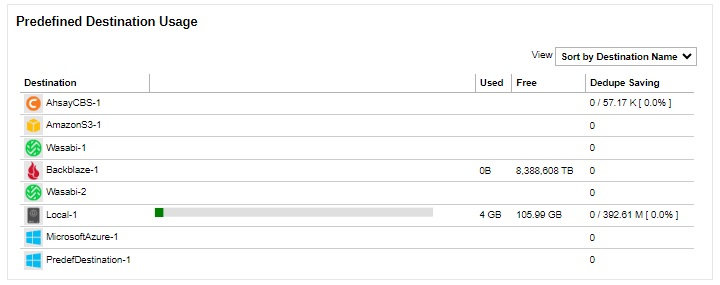
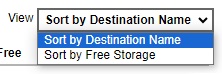
You can select to view the predefined destination entries sorted by Destination Name or Free Storage.
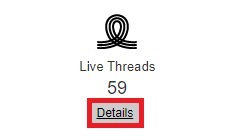
Live Threads
The following shows the “Live Threads” tab under Monitoring > Dashboard. It shows all the live threads that are running on this machine.
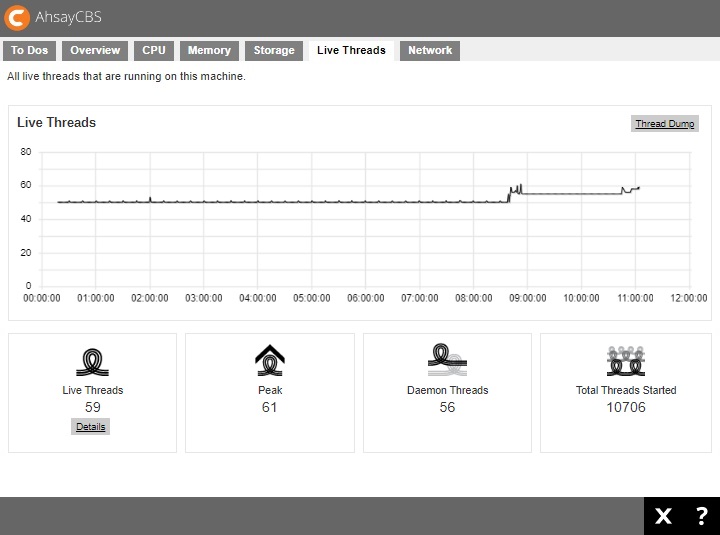
| Title | Description |
|---|---|
| Live Threads | Active process threads. |
| Peak | The largest number of live threads record in the above period. |
| Daemon Threads | Threads that are handled in the background. |
| Total Threads Started | The total number of started threads. |
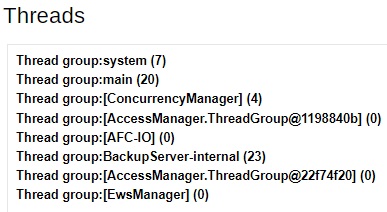
If you click on the Details button below the Live Threads icon, you will see a breakdown of all live threads that are running on this machine. It is shown as thread groups for developers or administrators reference.
Network
The following shows the “Network” tab under Monitoring > Dashboard. It shows all the network usage on this machine.
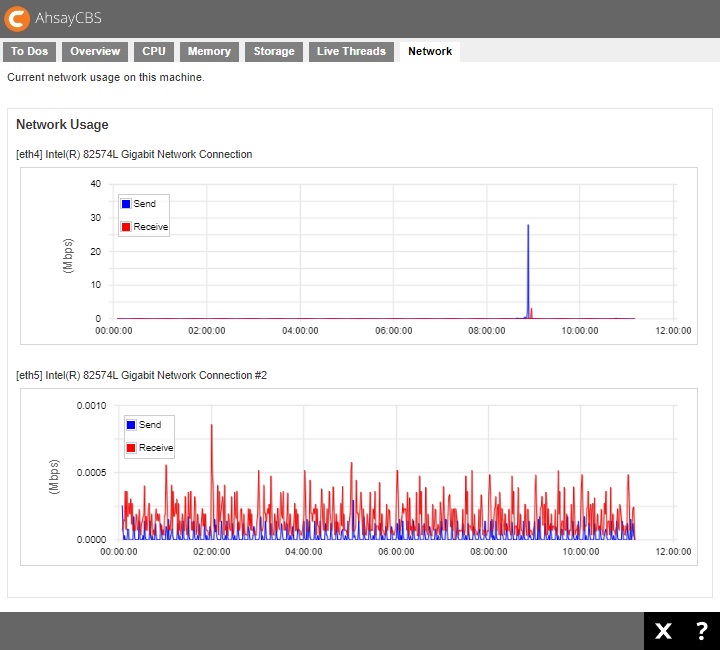
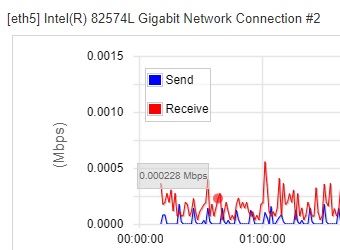
You can use mouse over at any point of the curve to obtain the network usage in Mbps at a particular time.
Live Activities
To check on the current backup and restore status with the progress monitor in percentage, simply click the Live Activities icon under “Monitoring” from your AhsayCBS web console.
![]()
Aside from backup and restore, you can also check the replication, receiver and redirection jobs that are currently running. As well as restore drill jobs that are pending or running.
There are six tabs, each of which is described below:
Backup Status
This section shows a list of agent based and agentless backup job(s) that is currently running. Once a backup job is completed, the entry will be immediately removed from the Live Activities.
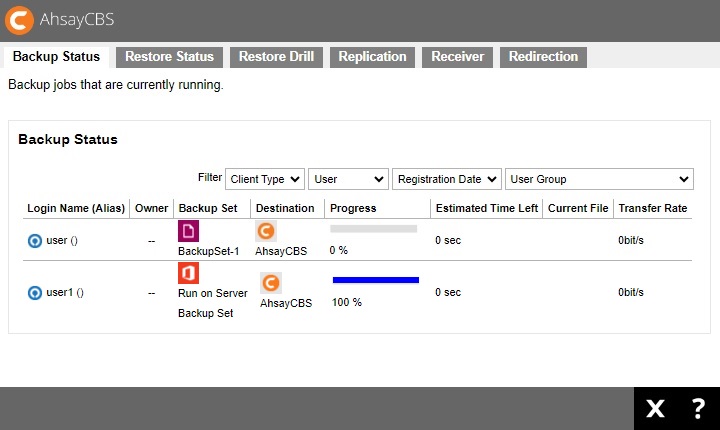
For agentless Microsoft 365 and Cloud File backup job(s), aside from monitoring the backup job(s) from here, each agentless backup Java process can also be monitored at an operating system level on the AhsayCBS server.
For more details on how to monitor the agentless backup Java process, please refer to Monitor Run on Server Backup Java Process.
It will also show a list of agent based and agentless backup job(s) that were terminated abnormally. Examples of these are:
- The backup machine was shutdown, rebooted or AhsayOBM/AhsayACB was killed using Windows Task Manager.
- AhsayOBM/AhsayACB client crashed during a backup job, the affected entries will be automatically cleared after 72 hours.
- Agentless Microsoft 365 and Cloud File backup job(s) that have become unresponsive and have been terminated. There are several methods to terminate the unresponsive agentless backup job(s). For more information, please refer to Terminate Unresponsive Run on Server Backup Jobs.
The following table shows if a backup type for a particular client can be monitored from the Backup Status tab.
| Backup Type | AhsayOBM | AhsayACB | Ahsay Mobile |
|---|---|---|---|
| File Backup | |||
| Cloud File Backup | |||
| IBM Lotus Domino Backup | |||
| IBM Lotus Notes Backup | |||
| MariaDB Backup | |||
| MS Exchange Server Backup | |||
| MS Exchange Mail Level Backup | |||
| MS SQL Server Backup | |||
| MS Windows System Backup | |||
| MS Windows System State Backup | |||
| MS Hyper-V Backup | |||
| MySQL Backup | |||
| Microsoft 365 Backup | |||
| Oracle Database Backup | |||
| ShadowProtect System Backup | |||
| VMware Backup | |||
| File Backup | ✔ | ✔ | NA |
| Cloud File Backup | ✔ | ✔ | NA |
| IBM Lotus Domino Backup | ✔ | NA | NA |
| IBM Lotus Notes Backup | ✔ | ✔ | NA |
| MariaDB Backup | ✔ | NA | NA |
| MS Exchange Server Backup | ✔ | NA | NA |
| MS Exchange Mail Level Backup | ✔ | NA | NA |
| MS SQL Server Backup | ✔ | NA | NA |
| MS Windows System Backup | ✔ | ✔ | NA |
| MS Windows System State Backup | ✔ | NA | NA |
| MS Hyper-V Backup | ✔ | NA | NA |
| MySQL Backup | ✔ | NA | NA |
| Microsoft 365 Backup | ✔ | ✔ | NA |
| Oracle Database Backup | ✔ | NA | NA |
| ShadowProtect System Backup | ✔ | NA | NA |
| VMware Backup | ✔ | NA | NA |
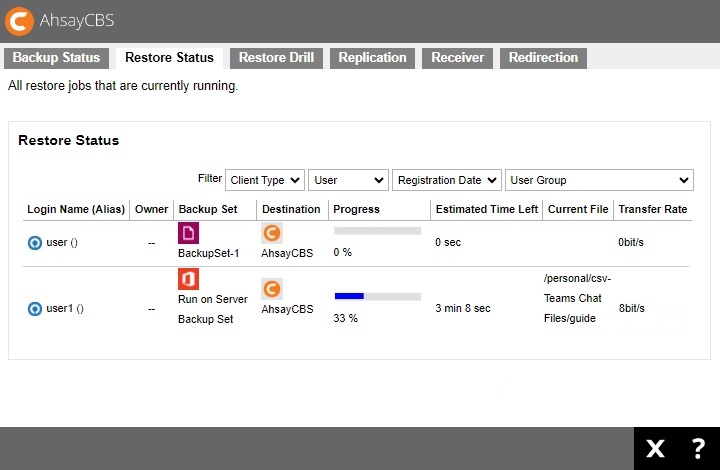
Restore Status
This section shows a list of agent based and agentless restore job(s) that is currently running. Once a restore job is completed the entry will be immediately removed from the Live Activities.
It will also show a list of restore job(s) that were terminated abnormally. Examples of these are:
- The backup machine was shutdown, rebooted or AhsayOBM/AhsayACB was killed using Windows Task Manager.
- AhsayOBM/AhsayACB client crashed during a restore job, the affected entries will be automatically cleared after 72 hours.
The following table shows if a backup type for a particular client can be monitored from the Restore Status tab.
| Restore Type | AhsayOBM | AhsayACB | Restorer | Ahsay Mobile | |
|---|---|---|---|---|---|
| File Backup | |||||
| Cloud File Backup | |||||
| IBM Lotus Domino Backup | |||||
| IBM Lotus Notes Backup | |||||
| MariaDB Backup | |||||
| MS Exchange Server Backup | |||||
| MS Exchange Mail Level Backup | |||||
| MS SQL Server Backup | |||||
| MS Windows System Backup | |||||
| MS Windows System State Backup | |||||
| MS Hyper-V Backup | |||||
| MySQL Backup | |||||
| Microsoft 365 Backup | |||||
| Oracle Database Backup | |||||
| ShadowProtect System Backup | |||||
| VMware Backup | |||||
| File Backup | Normal Restore | ✔ | ✔ | ✔ | NA |
| OpenDirect Restore | ✖ | ✖ | ✖ | NA | |
| Cloud File Backup | ✔ | ✔ | ✔ | NA | |
| IBM Lotus Domino Backup | ✔ | NA | ✔ | NA | |
| IBM Lotus Notes Backup | ✔ | ✔ | ✔ | NA | |
| MariaDB Backup | ✔ | NA | ✔ | NA | |
| MS Exchange Server Backup | ✔ | NA | ✔ | NA | |
| MS Exchange Mail Level Backup | ✔ | NA | ✔ | NA | |
| MS SQL Server Backup | ✔ | NA | ✔ | NA | |
| MS Windows System Backup | ✔ | ✔ | ✔ | NA | |
| MS Windows System State Backup | ✔ | NA | ✔ | NA | |
| MS Hyper-V Backup | Normal Restore | ✔ | NA | ✔ | NA |
| Run Direct Restore | ✔ | NA | ✔ | NA | |
| Granular Restore with AhsayOBM File Explorer | ✔ | NA | ✔ | NA | |
| Granular Restore with Windows File Explorer | ✖ | NA | ✖ | NA | |
| MySQL Backup | ✔ | NA | ✔ | NA | |
| Microsoft 365 Backup | ✔ | ✔ | ✔ | NA | |
| Oracle Database Backup | ✔ | NA | ✔ | NA | |
| ShadowProtect System Backup | ✔ | ✔ | ✔ | NA | |
| VMware Backup | Normal Restore | ✔ | NA | ✔ | NA |
| Run Direct Restore | ✔ | NA | ✔ | NA | |
| Granular Restore with AhsayOBM File Explorer | ✔ | NA | ✔ | NA | |
| Granular Restore with Windows File Explorer | ✖ | NA | ✖ | NA | |
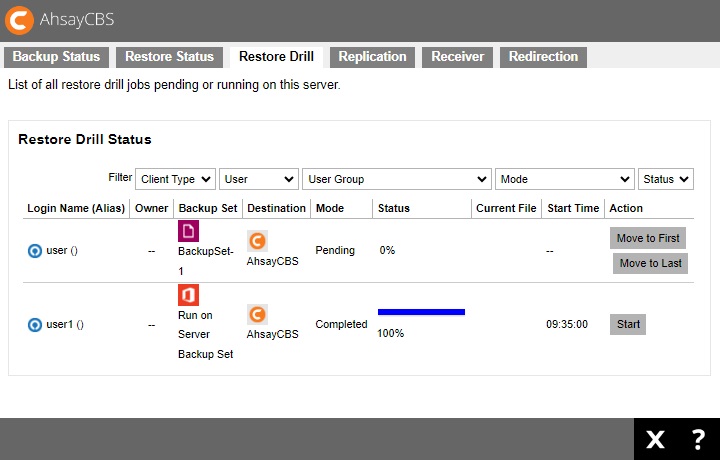
Restore Drill
This section shows a list of backup set where the restore drill was performed.
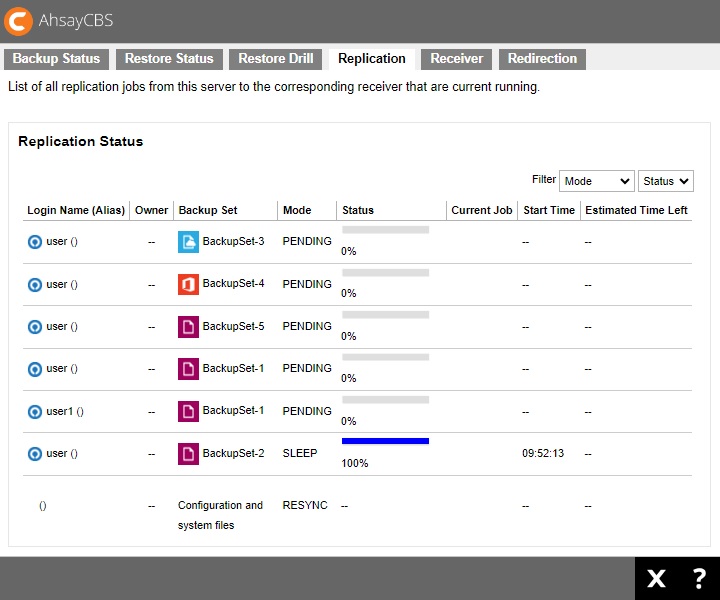
Replication
Here is the replication jobs status from the backup server to the corresponding receiver.
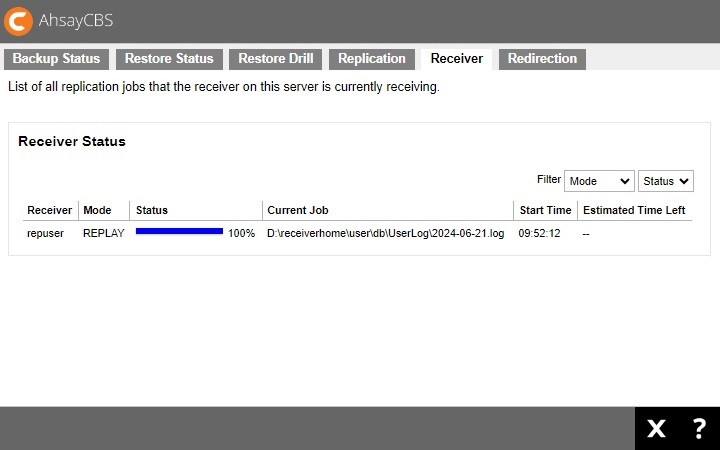
Receiver
In this menu, you will see all the replication jobs that the receiver on this server is currently running.
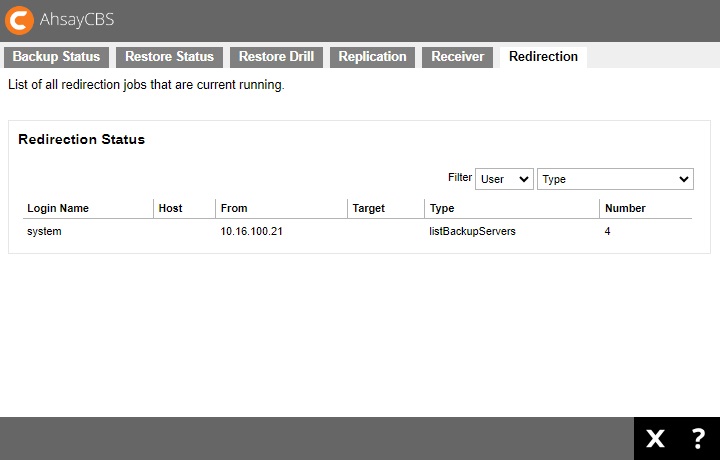
Redirection
You can see a list of all redirection jobs that are currently running.
Administration Logs
To check on the SNMP logs, list of notifications/announcements/alerts, activities logs and audit trail, simply click the Administration Logs icon under “Monitoring” from your AhsayCBS web console.
![]()
There are four tabs, each of which is described below:
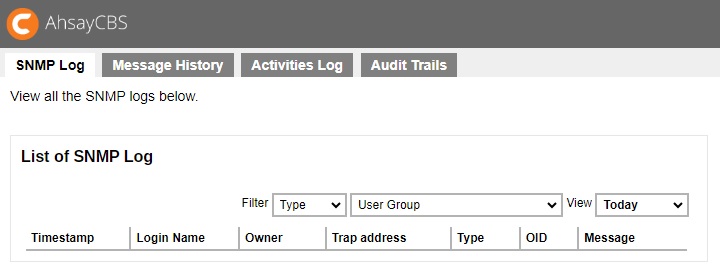
SNMP Log
You can see a list of SNMP log message in this page. You need to enable the SNMP log in System Settings > Advanced > Logging > Enable SNMP Service and need to download the MIB definition file and pass to your SNMP machine. The logs may be filtered by type, user group and date.
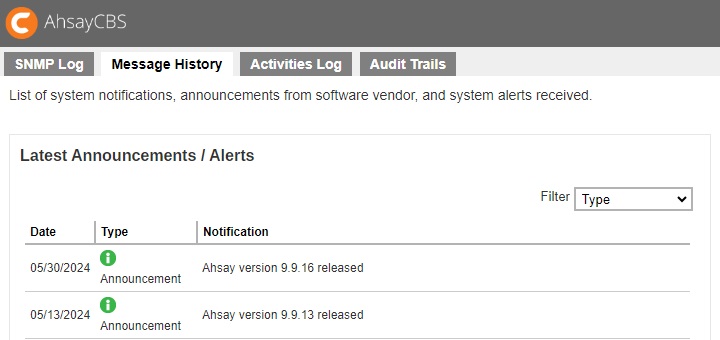
Message History
This page contains a list of notifications, announcements and alerts. The logs may be filtered by type.
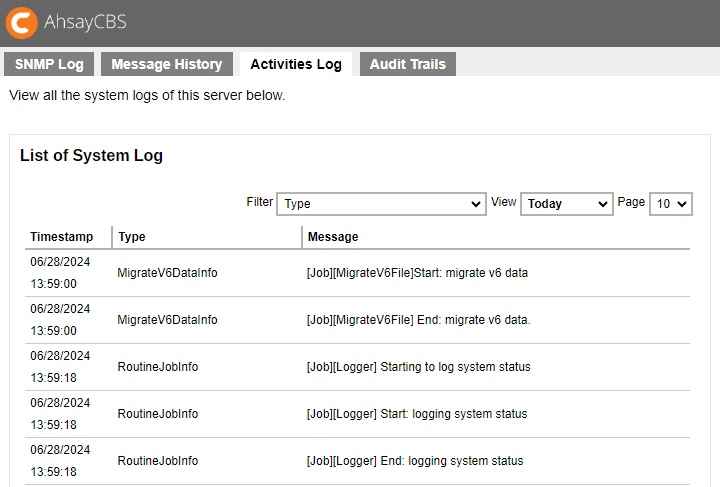
Activities Log
In this page, you will see a list of activities/system logs generated by system events, v6 migration or other user activities. The logs may be filtered by type and date.
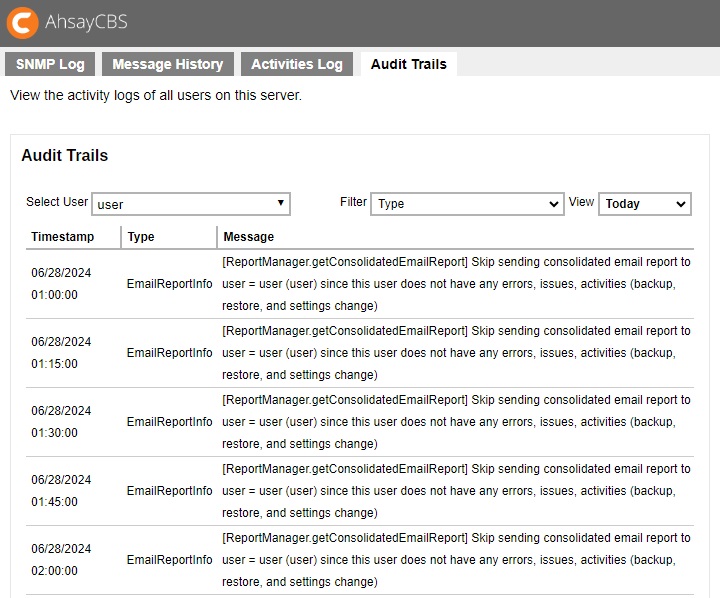
Audit Trails
In this page, you can only see the activity logs of the selected user. The logs may be filtered further according to type and date.
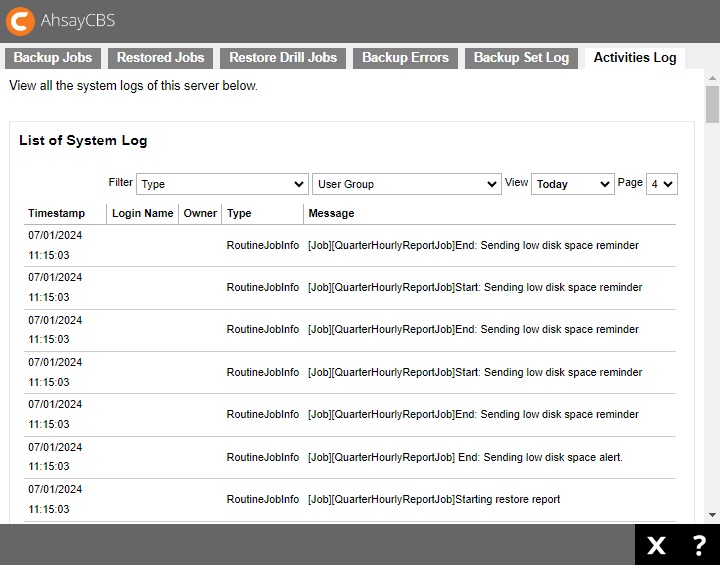
Backup / Restore Logs
To check the list of backup and restore jobs, restore drill jobs, backup errors, backup set logs and activities logs, simply click the Backup / Restore Logs icon under “Monitoring” from your AhsayCBS web console.
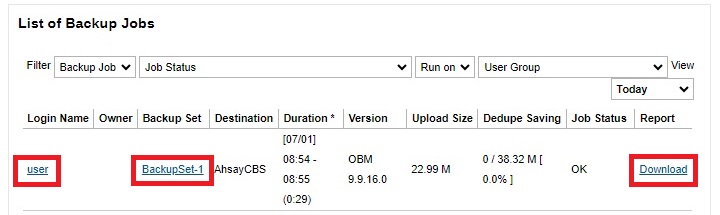
![]()
The username and backup set are clickable links that will directly take you to the user details and backup set details. The report can also be downloaded directly by clicking the “Download” link
There are six tabs, each of which is described below:
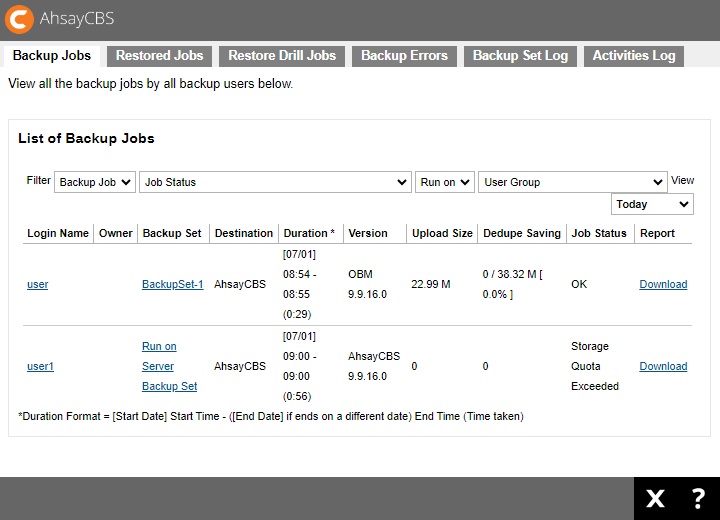
Backup Jobs
Here is a summary of the backup jobs. The logs may be filtered by backup job, job status, where the backup was run either client or server, user group and date.
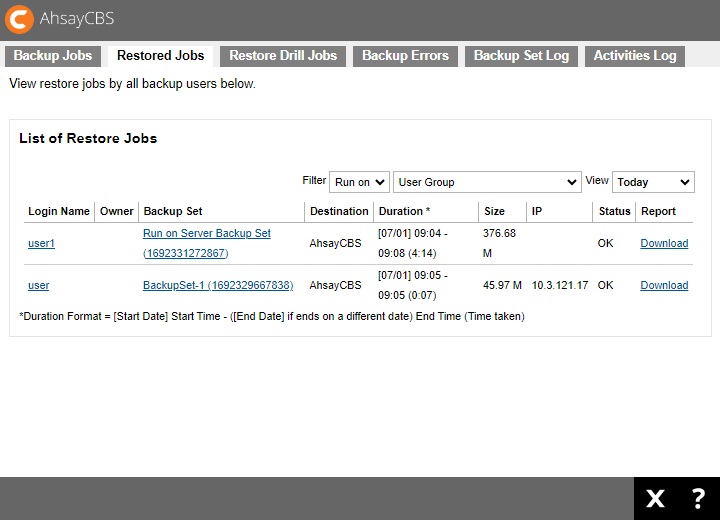
Restored Jobs
Here is a summary of the restored jobs. The logs may be filtered by user group, date and where it was run either client or server.
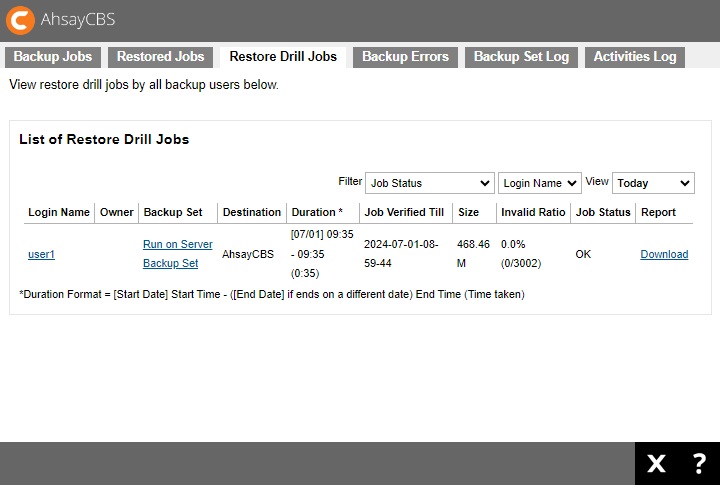
Restore Drill Jobs
Here is a summary of the restore drill jobs. The logs may be filtered by job status, login name and date.
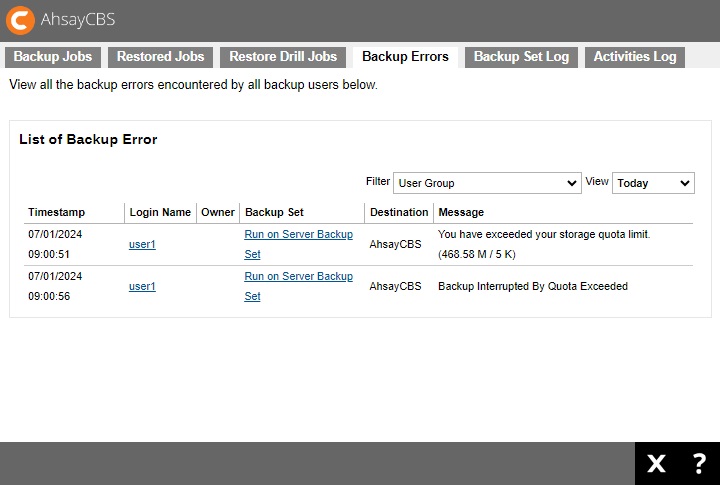
Backup Errors
Here is a summary of the backup errors encountered by all backup users. The logs may be filtered by user group and date.
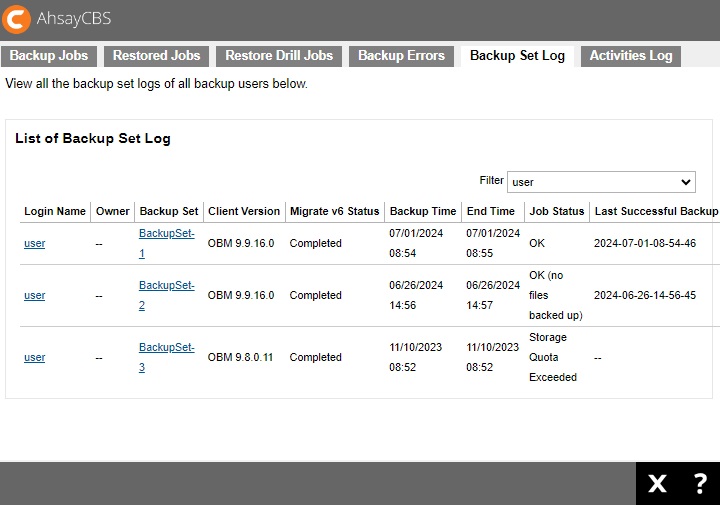
Backup Set Log
Here is a summary of backup set logs of backup users. The logs may be filtered by user or user group.
Activities Log
Here is a list of backup/restore related system activities logs. The logs may be filtered by type, user group, date and page.
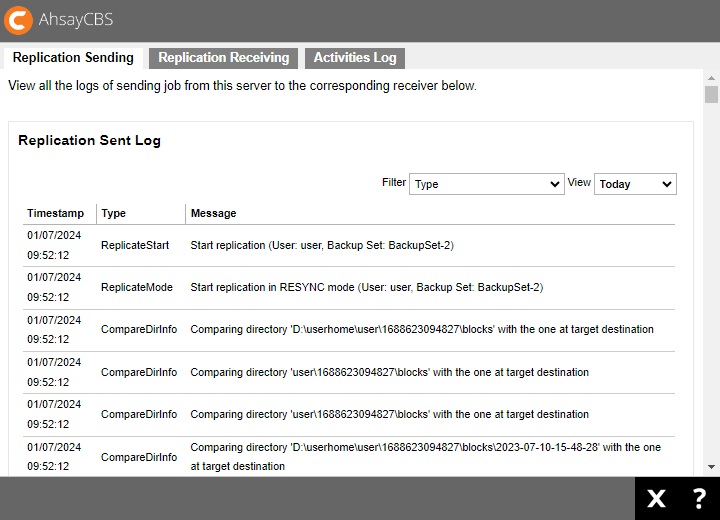
Replication Logs
To check the list of send, receive and activities logs, simply click the Replication Logs icon under “Monitoring” from your AhsayCBS web console.
![]()
There are three tabs, each of which is described below:
Replication Sending
You can see a list of sending job from the AhsayCBS to the corresponding receiver. Logs can be filtered by type and date.
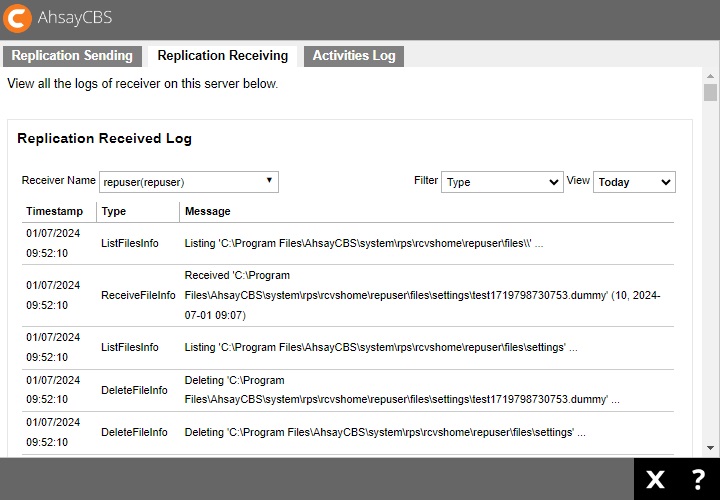
Replication Receiving
Here is the receiver log on the AhsayCBS. It only shows the logs of the selected receiver. Logs can be filtered further by type and date.
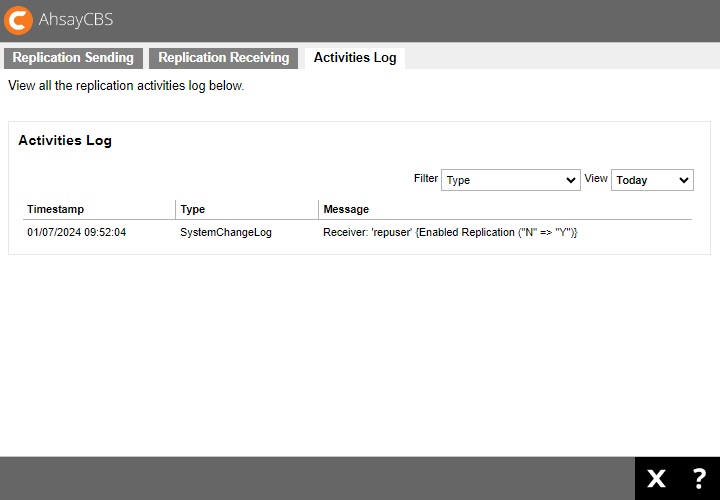
Activities Log
Here is the page to view all the replication activities log, such as creation of new receiver, changes in the settings, retention policy job etc.
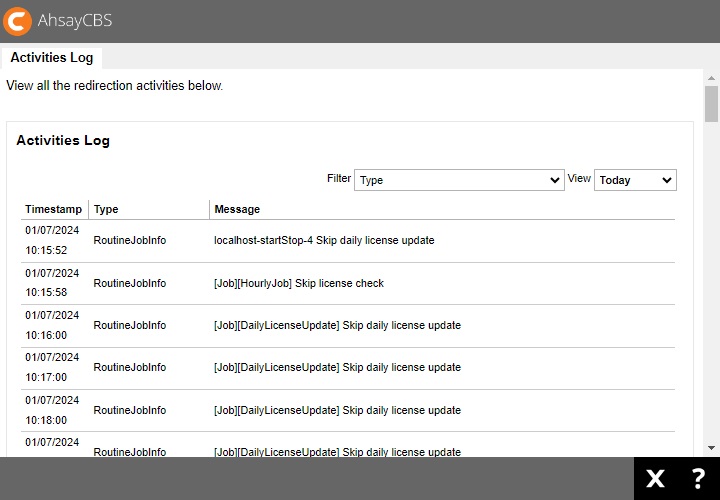
Redirection Logs
To check on the redirection activity logs, simply click the Redirection Logs icon under “Monitoring” from your AhsayCBS web console. The logs may be filtered by type and date.
![]()